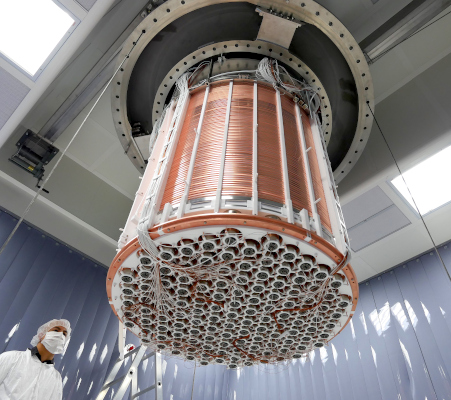
The Xenon1T experiment has just announced a really interesting excess of events, which could be due to axions or some other new particle or effect. It’s a nice result from a difficult experiment and the research team deserve a lucky break. Of course like any discovery it could be a rare statistical fluctuation which will go away when more data is taken. They quote the significance as 3.5 sigma, and we can actually follow this: they see 285 events where only 232 are expected: the surplus of 53 is just 3.5 times the standard deviation you would expect from Poisson statistics: 15.2 events, the square root of 232.
This is all fine. But the press accounts – as in, for example, Scientific American, report this as “there’s about a 2 in 10,000 chance that random background radiation produced the signal”. It’s nothing of the sort.
Yes, the probability of exceeding 3.5 sigma (known as the p-value) is actually 2.3 in 10,000. But that’s not the probability that the signal was produced by random background. It’s the probability that random background would produce the signal. Not the same thing at all.
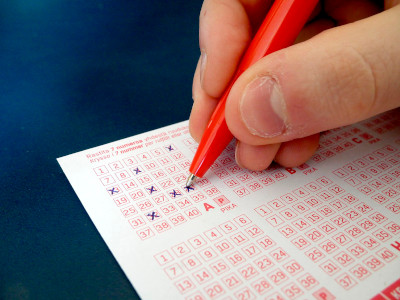
What’s the difference? Well, if you buy a lottery ticket there is, according to Wikipedia, a 1 in 7,509,578 chance of winning a million pounds. Fair enough. But now you meet a millionaire and ask “What is the chance they got that way through last week’s lottery?” it’s certainly not 1 in 7,509,578.
There are several paths to riches: inheritance, business and of course previous lottery winners who havn’t spent it all yet. The probability that some plutocrat got that way through a particular week’s lottery depends not just on that 1 in 7,509,578 number but on the number of people who buy lottery tickets, and the number of millionaires by who made their pile by other means. (It’s then just given by Bayes’ theorem – I’ll spare you the formula.) You can’t find the answer by just knowing p, you need all the others as well.
There is a 1 in 7 chance that your birthday this year falls on a Wednesday, but if today is Wednesday, the probability that it’s your birthday is not 1 in 7. Your local primary school teacher is probably a woman, but most women are not primary teachers. All crows are black, but not all black birds are crows. Everyday examples are all around. For instance – to pick an analogous one – if you see strange shapes in the sky this could be due to either flying saucers or to unusual weather conditions. Even if a meteorologist calculates that such conditions are very very unusual, you’ll still come down in favour of the mundane explanation.
 So going back to the experiment, the probability that random background would give a signal like this may be 1 in 20,000 but that’s not the probability that this signal was produced by random background: that also depends on the probabilities we assign to the mundane random background or the exotic axion. Despite this 1 in 20,000 figure I very much doubt that you’d find a particle physicist outside the Xenon1T collaboration who’d give you as much as even odds on the axion theory turning out to be the right one. (Possibly also inside the collaboration, but it’s not polite to ask.)
This is a very common mistake – every announcement of an anomaly comes with its significance reported in terms of the number of sigma, which somebody helpfully translates into the equivalent p-value, which is then explained wrongly, with language like “the probability of the Standard Model being correct is only one in a million” instead of “the probability that the Standard Model would give a result this weird is only one in a million”. When you’re communicating science then you use non-technical language so people understand – but you should still get the facts right.
